Rank your portfolio.
Own your city.
- Free to rank
- Your figures stay private
- Observed and modelled figures marked apart
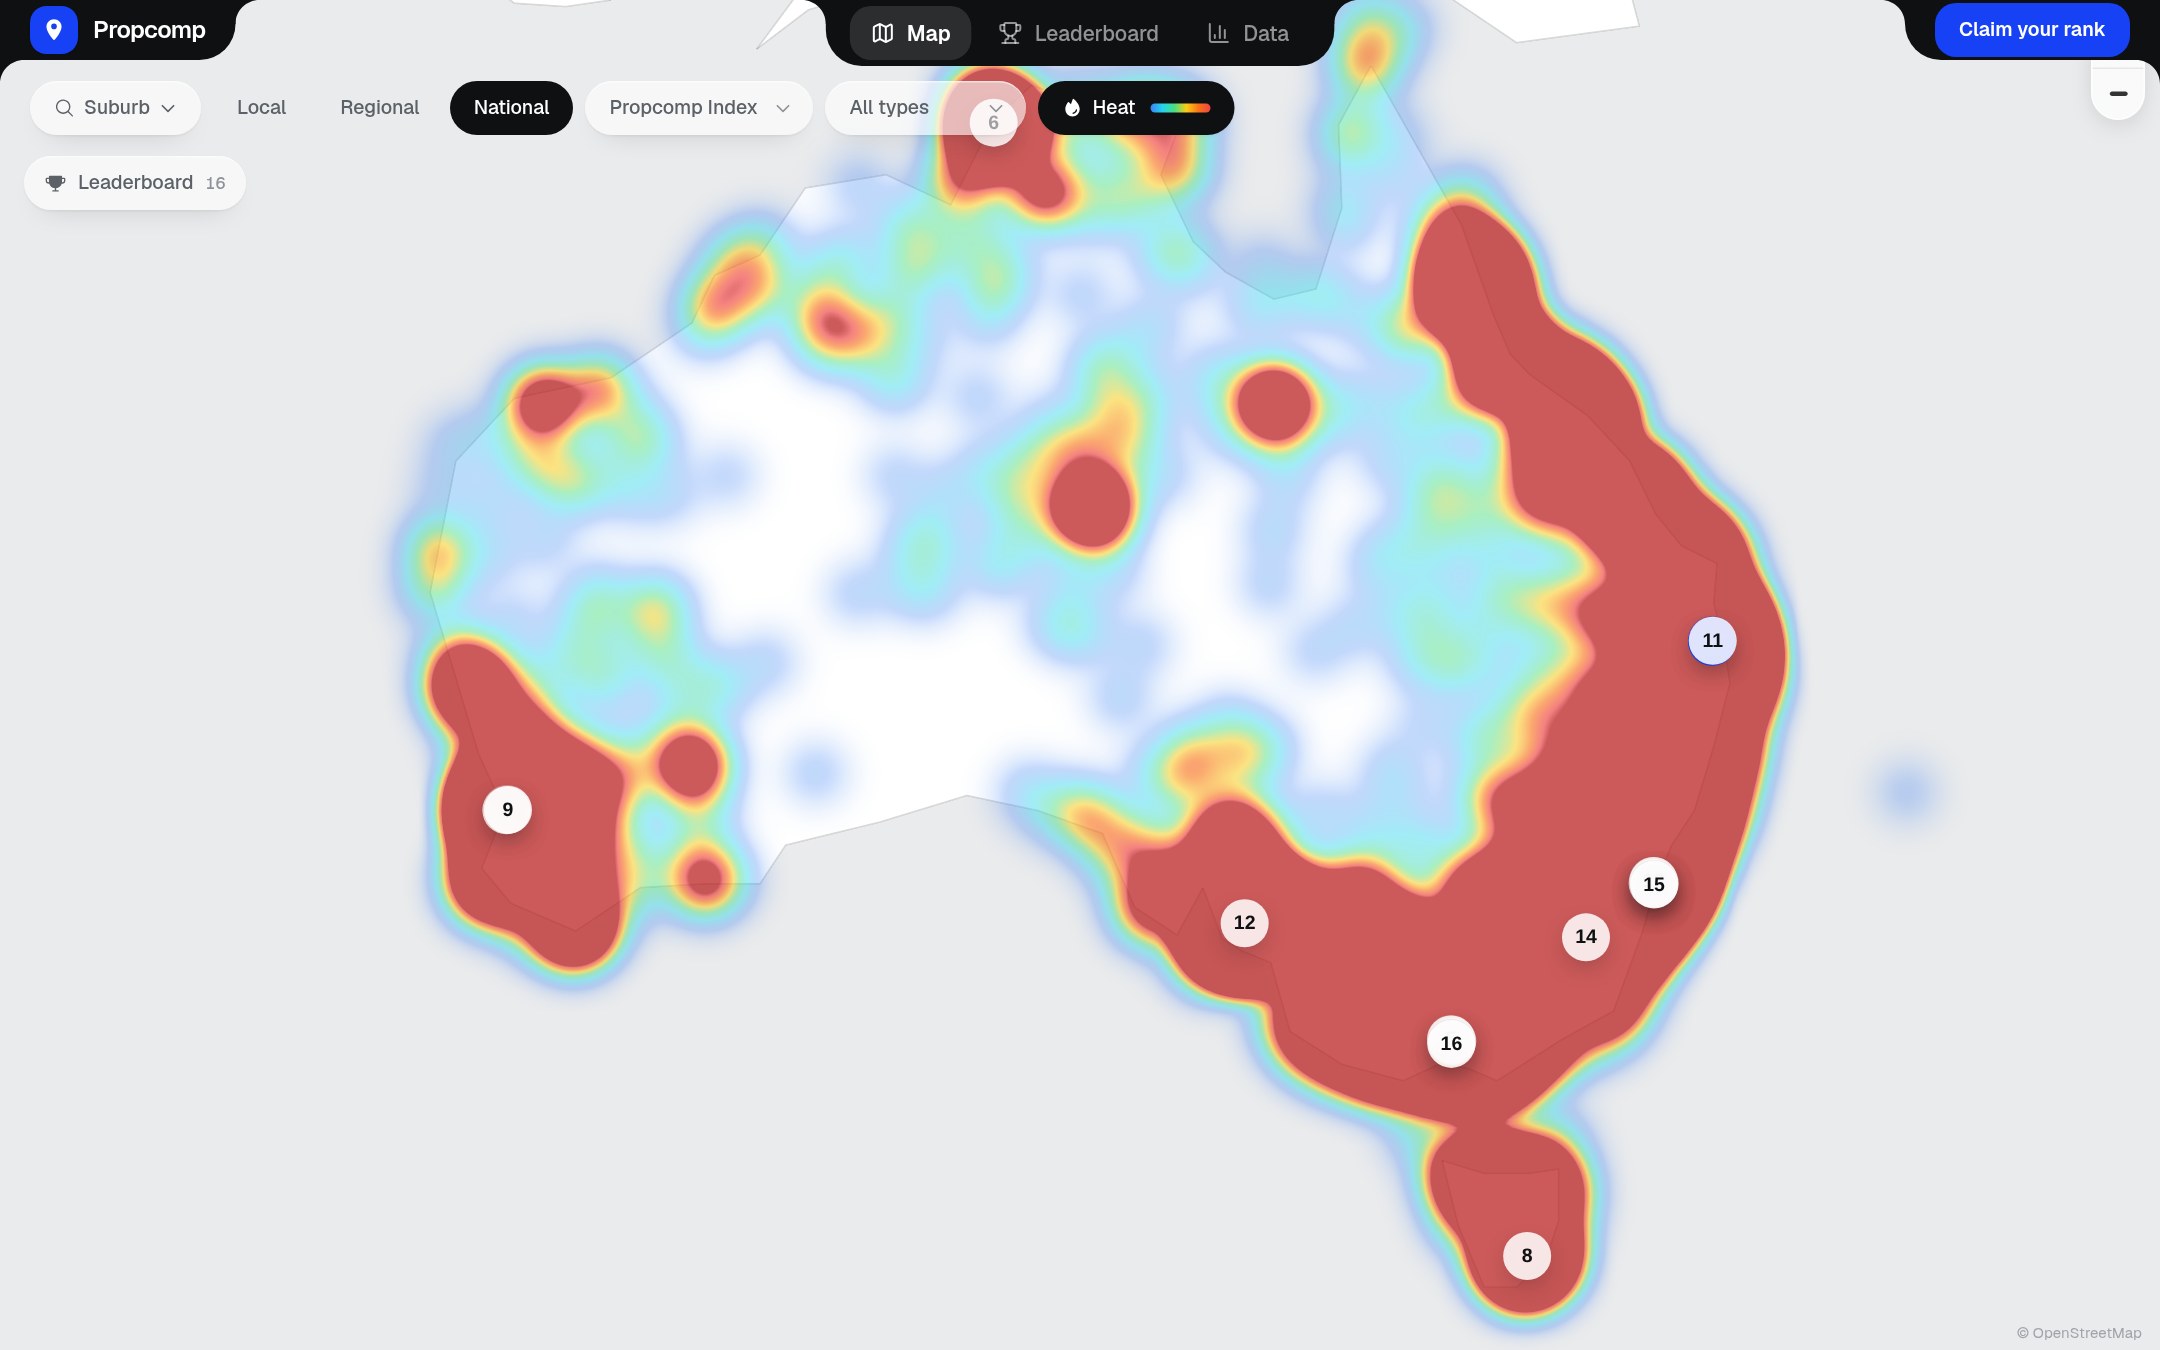

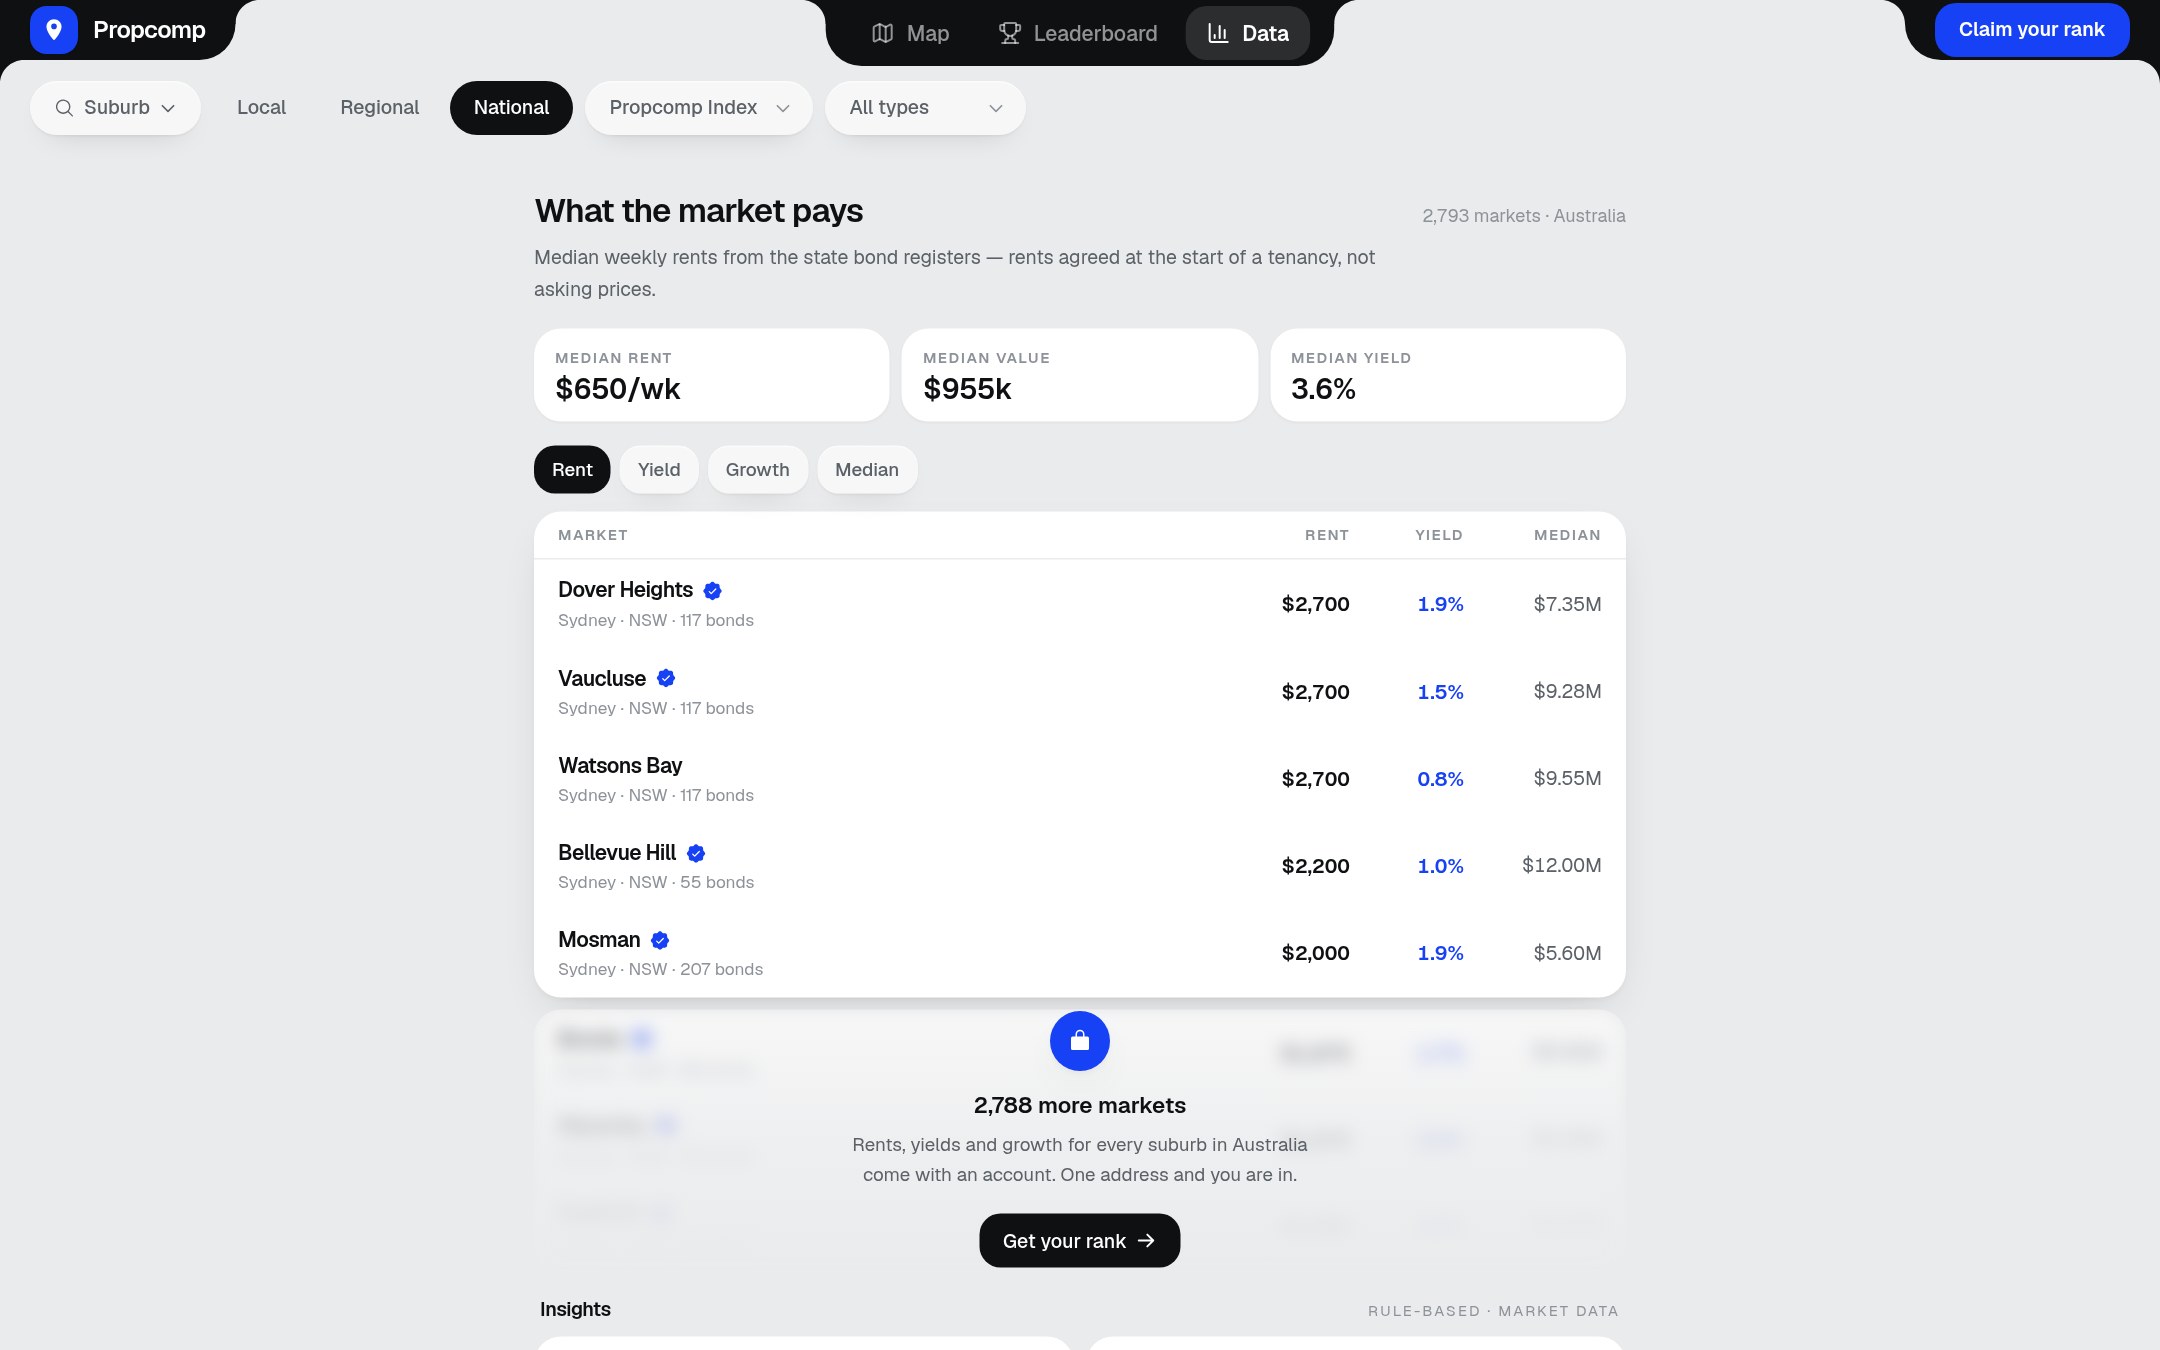
Every suburb in Australia, live.
7,170 markets on one map, shaded by what they are doing. Click anywhere and the numbers for that suburb come up — median, rent, yield, growth.
Open the mapReal portfolios, ranked on real numbers.
Propcomp ranks members on yield, growth and equity. See where you sit locally, across your state and nationally, and what to do next.
Haven't bought yet? Join before you buy and watch the markets you're weighing up.
7,170 suburbs
every market in Australia
Yield, growth, LVR
five ways to rank
Local to national
three boards, one portfolio
National board
Live- 1TomiNew Farm, QLD6,038
- 2HenryCottesloe, WA6,004
- 3LucaToorak, VIC5,794
Three boards. One portfolio.
The same performance, ranked at three altitudes. Climb one, climb them all.
Local
Your suburb and the ones next door. The market you hold and grow every single week.
in your suburb
Regional
Every investor working your state, on one board. The league your peers actually talk about.
across your state
National
The whole country, ranked. The number that puts you in the room with the best in Australia.
on the big board
Why investors check it every morning
Real sold prices
State valuer-general sale medians and bond-register rents, suburb by suburb. Where a figure is an estimate, it is labelled an estimate.
Winning is the point
Weekly movement and the top spot on your patch, ranked locally, across your state and nationally. Ranking is the habit that keeps you buying well.
Genuine research
Yield, growth, LVR and diversification behind every rank. Just the numbers that move you up the board.
Ask the people who own there
A forum where answers come from investors already holding in that market. Votes lift the good ones, and the asker marks what actually solved it.
Real numbers, and what we do with yours.
A ranking is only worth something if the figures under it are, and only worth joining if what you put in stays yours. Both sides of that, in full.
Where the numbers come from
- Rents from the bond registersEvery tenancy in Australia lodges a bond with a state authority. The weekly rents here are the medians off those registers — rents people agreed to pay, not asking prices.
- Sales from the Valuer-GeneralMedians and growth come from state sale records where a state publishes them. Where they do not, the figure is modelled — and it says so, on the figure.
- Geography from OpenStreetMap7,170 suburbs, towns and localities with surveyed coordinates. Nothing on the map is placed by hand.
What happens to yours
- Your figures are yoursYour address, your valuations and your loans are visible to you. What the board shows is your rank and the suburb you hold in.
- Three before anything publishesCommunity numbers — what a suburb's momentum is, which markets are wanted — wait until three different members are behind them. One member is never a statistic.
- Leave and it goesRemove a property and it leaves the board with you. We do not sell contact lists, to partners or to anyone else.
Every figure in the app carries its basis — observed or modelled, and how many sales or bonds are behind it. Open any suburb and look for yourself.
Free to rank. Open to partners.
Ranking is free for every member, and stays that way. If you are a buyers agent, broker, property manager or data provider who wants to work with Propcomp, tell us what you have in mind.
Partner with Propcomp
We are early, and choosing who we build alongside. Register your interest and we will come back to you about what a partnership could look like.
No pricing yet and nothing to commit to. This is an expression of interest, not an application.
An expression of interest, not an application.